
The Ghost in the Machine: How Solid drastically accelerates semantic model generation
The typical midsize enterprise has over 100 semantic models, some distinct some partially overlapping. Documenting those by hand is a fool's errand. Tal, Solid's CTO & Co-Founder, shares our solution.

We’ve talked about how semantic layers have seen a resurgence recently as a means to enable “chat with your data”, and other AI-based use-cases with enterprise data. We even, recently, discussed the concept of using AI to help AI.
The case for doing this is clear.
The question then becomes, “How?”
In this post, I will share a small part of our how. Specifically, the part that, doesn’t use GenAI/LLMs (gasp!). This part uses “normal” data science algorithms. It’s a crucial part that comes before the LLMs in our process.
Preamble
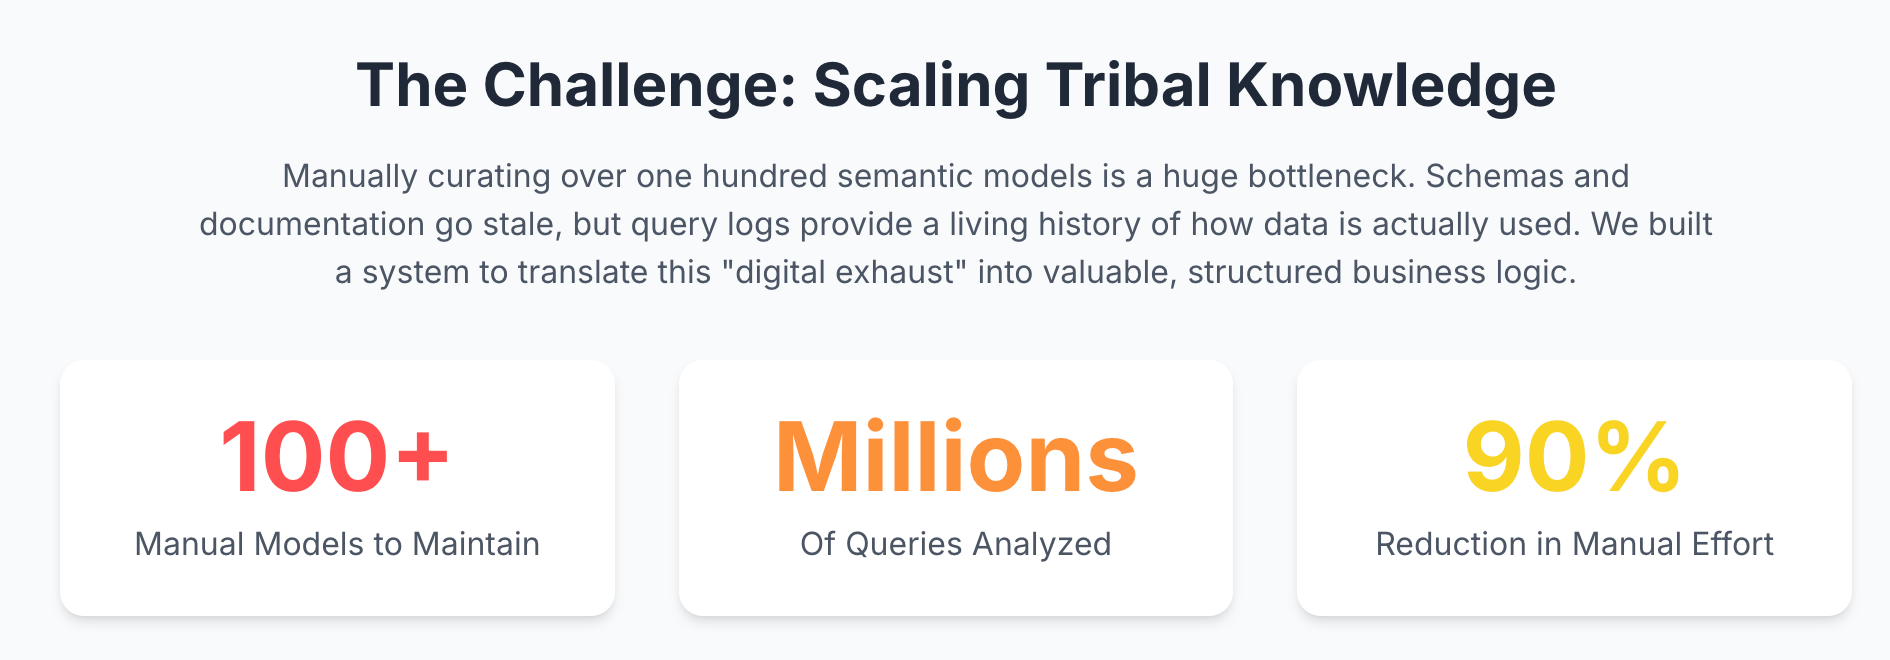
How many semantic models does your data team need? 10? 50? For a mid-sized enterprise, it’s over 100 - each one a critical, manually curated lens into the business. These models are the lifeblood of our analytics, but they’re also a bottleneck, relying on the tribal knowledge of a few key analysts.
What happens when they leave? How do you scale that knowledge? At Solid we are taking on this challenge, to automatically discover and create the 100 semantic models that represent the most critical data models, directly from the data warehouse itself.
We realized that schemas and documentation are often outdated a mere days after they’re written. But what if the logic isn’t in the design but in the usage? The query logs, often seen as simple operational records, are actually a living history of every business question ever asked of the data. They are the ghost in the machine, and we realized we could learn its language.
A four-step process
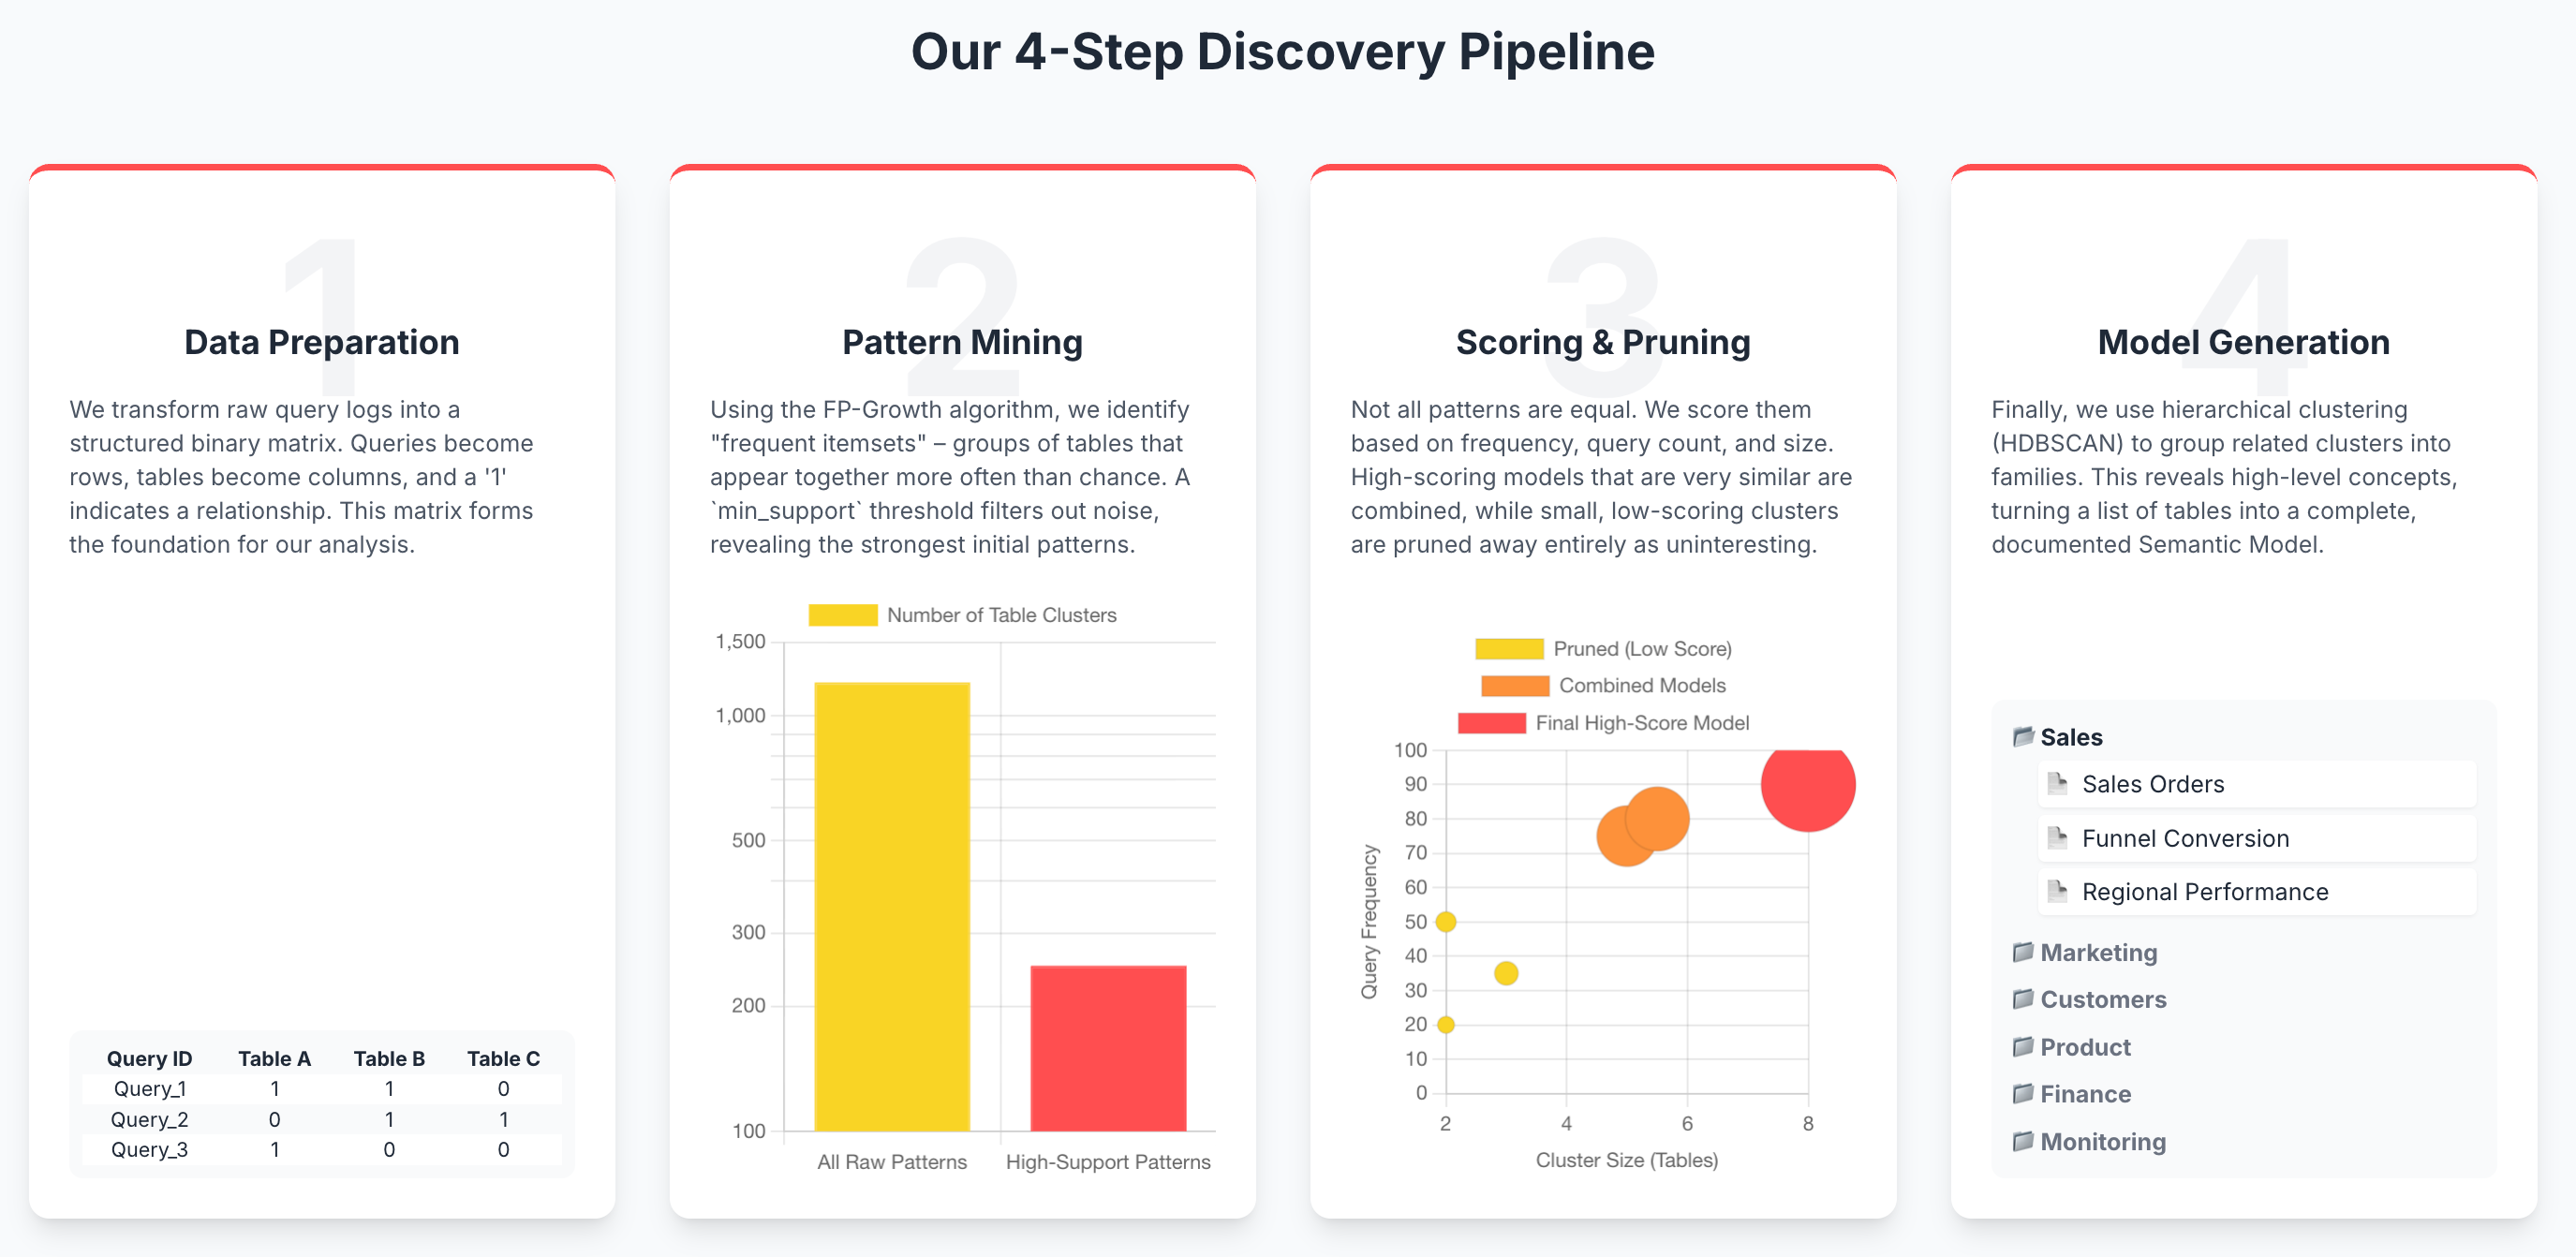
Our process follows four main steps to translate this digital exhaust into business insight:
Step 1: Data Preparation & Matrix Construction. We first process and clean the raw query logs into a structured format that an algorithm can understand.
Step 2: Frequent Pattern Mining. We use the FP-Growth algorithm to discover groups of tables that are frequently used together in queries.
Step 3: Cluster Scoring & Pruning. We score these table groups to find the most meaningful ones and remove redundant, overlapping clusters.
Step 4: Hierarchical Analysis & Model Generation. Finally, we group related clusters together to form comprehensive, high-level semantic model clusters.
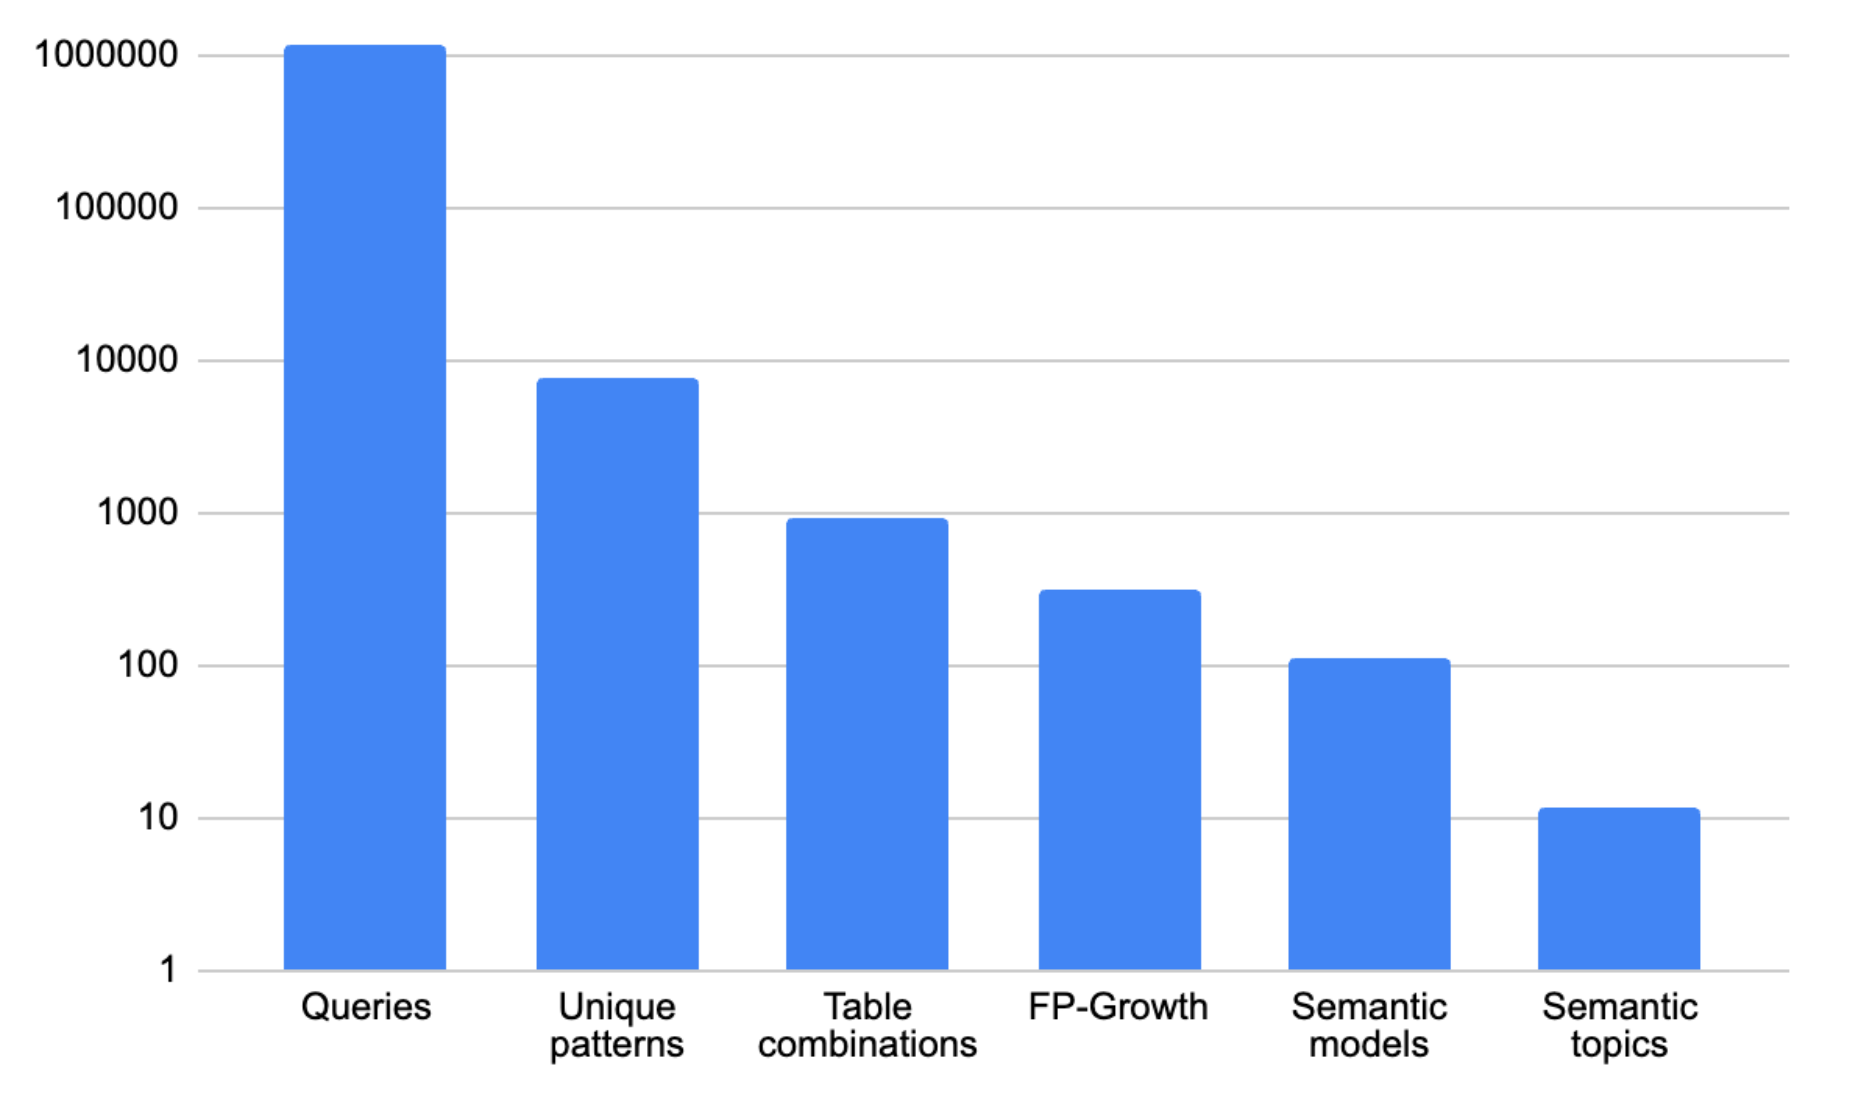
Here are the relative numbers of items at each step of this process - from over 1M queries, down to 110 semantic models across 12 semantic topics:
Step 1: Data Preparation & Matrix Construction
Our approach is a bit like digital archaeology. We treat the query log as our primary artifact. To use an algorithm like FP-Growth, you first need to build a matrix with the queries as rows and the tables as columns. If a query ‘A’ uses tables ‘X’ and ‘Y’, then the cells MAT[A,X] and MAT[A,Y] are marked. We enhance this by adding weight to account for the number of times a query is executed, using a log function so that extremely frequent queries don’t dominate the results. We also prune queries that only touch a single table, as they don’t reveal relationships, and we group together queries that are functionally identical (e.g., the same query with a different date filter).
Step 2: Frequent Pattern Mining with FP-Growth
With the data prepared, the goal is to find groups of tables that are consistently used together, as these “cliques” represent a real business concept, like “customer orders” or “inventory levels.” To find these patterns in millions of queries, we chose the FP-Growth (Frequent Pattern Growth) algorithm. Unlike older methods, it’s remarkably memory-efficient and built to handle the sparse nature of this data. By setting a min_support threshold, we can tune its sensitivity, telling it to only pay attention to table combinations that appear more frequently than mere chance would allow.
Step 3: Cluster Scoring & Pruning
Finding raw patterns isn’t enough; it often creates a lot of noise. A simple two-table join might be frequent, but is it more meaningful than a five-table cluster that’s slightly less common but represents a complex business process? This is where our secret sauce comes in. We developed a multi-factor scoring system that elevates the most valuable clusters by considering not just raw frequency, but also by boosting the score for clusters used in heavily executed queries and adding a gentle boost for size. We then prune away redundant smaller clusters. To do this, we identify clusters that are subsets of larger ones and compare not only their tables but also the columns used and their business descriptions to confirm they serve the same purpose. This allows us to merge very similar patterns into a single, cohesive model.
Step 4: Hierarchical Analysis & Model Generation
Finally, we piece the puzzle together. We take these refined clusters and run them through a hierarchical clustering algorithm (HDBSCAN, for the curious) to find families of related concepts. By analyzing similarities in their columns and data sources, we can understand, for example, that “Sales Orders” and “Sales Conversion Rates” are distinct but related concepts that both belong under a larger “Sales” umbrella.
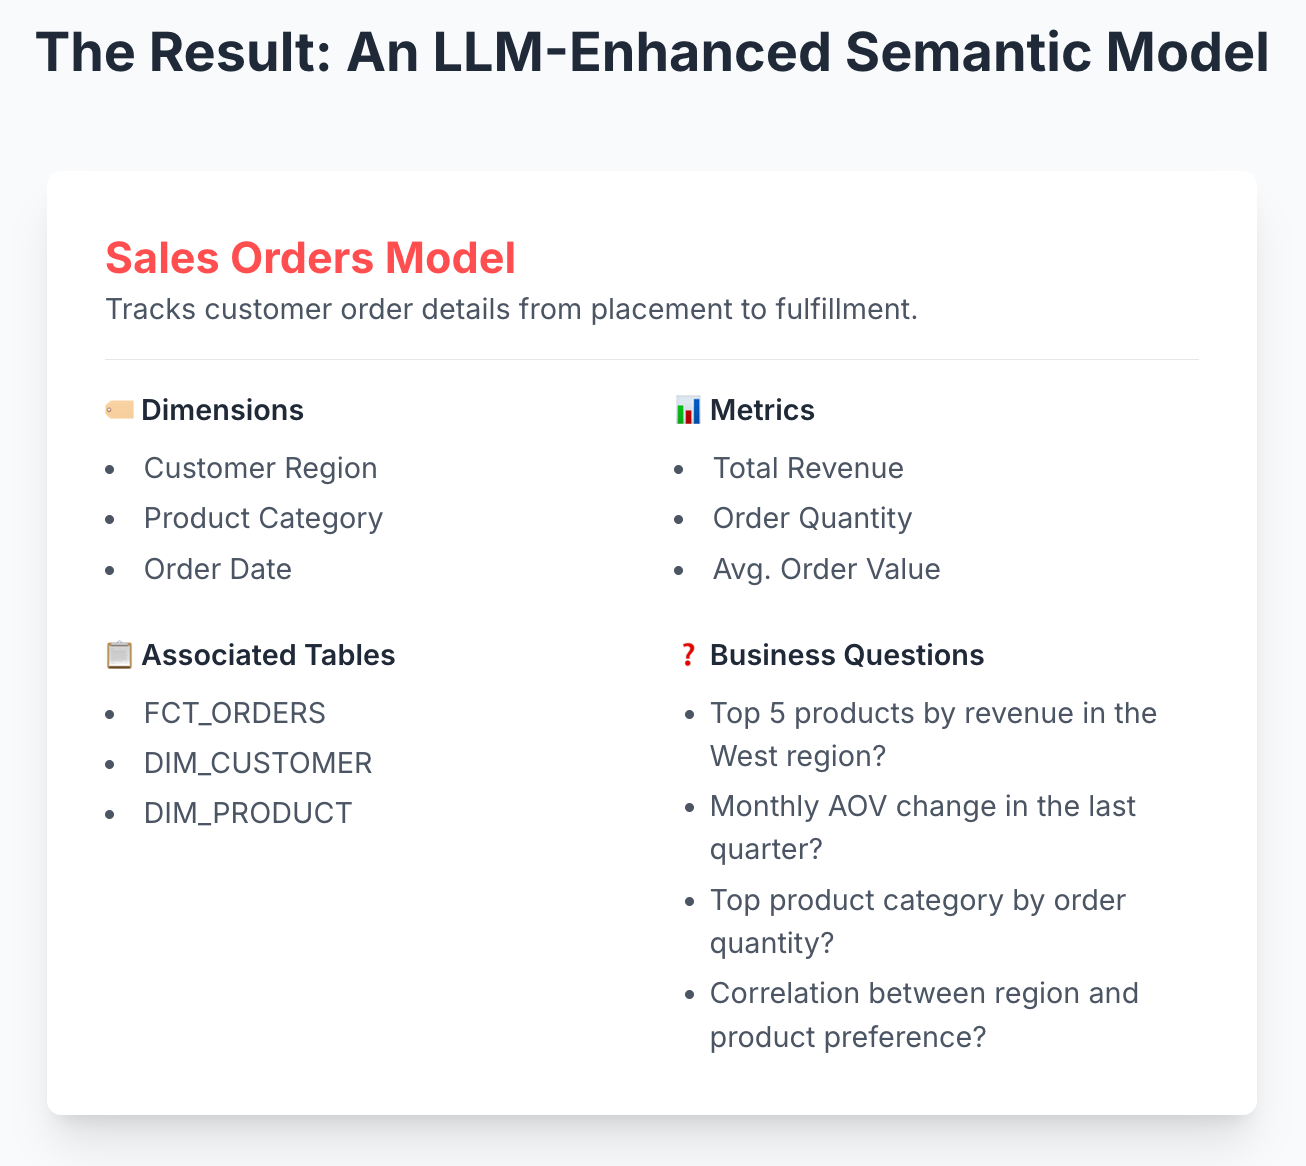
The result isn’t just a list of tables. It’s a Semantic Model: a coherent, business-centric view of your data, complete with a human-readable name, a description of its purpose, dimensions, metrics, relationships, and even a set of representative business questions it can answer.
By listening to the ghost in the machine, we can build a living, breathing map of your business logic, ensuring that vital knowledge is never lost-it’s discovered.
If you are looking to get AI to chat with your data in BigQuery, or leverage Databricks Genie or Snowflake Intelligence, reach out to us.
sorry but i think this brilliant....that said, i seriously wonder how many 'users' who should 'get it' with 'get it'....my experiences running 'vibe analytic' promptathons and observing how many people actually 'engage' with LLMs makes me nervous....