

Github Repository Used in this Project: https://github.com/solid-data-public/powerbi-poc
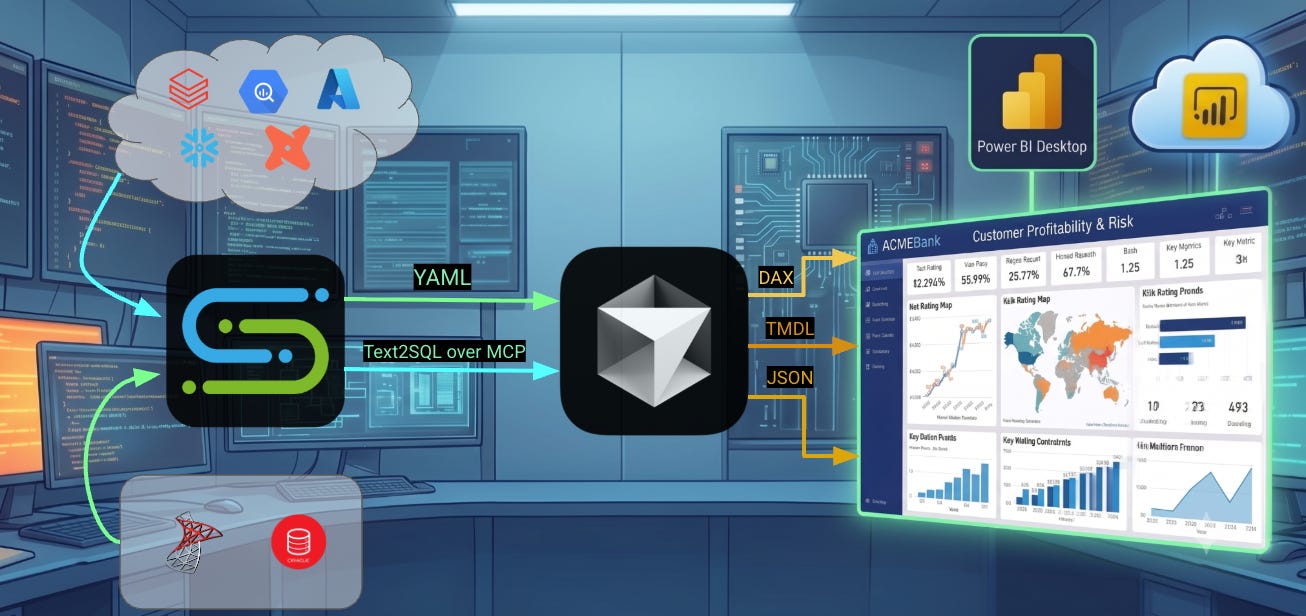
If you read my last two blog posts, Human Analyst vs. AI Analyst and Human Plus AI Analyst: Defying Gravity, you know I’m a believer in AI tools augmenting analytics processes, rather than it “replacing” anyone. Those demos, especially with Cursor & Google Antigravity, were really cool, and it’s only become much more powerful since I wrote those articles 7 months ago.
I think I cracked something even better for BI developers, analysts, and even non-technical business people who want to be able to develop reports. Agentic BI Development.
I pointed Cursor at a semantic model built in Solid, gave it a scaffold, and asked it to build a Power BI report. A few minutes later I had a complete Power BI project: semantic model, relationships, DAX measures, report pages, the whole thing. All of which opened cleanly in Power BI Desktop.
I never opened Power BI to build any of it. That still feels a little revolutionary to say out loud.
PBIR Changed Everything
For years, a Power BI report was a sealed .pbix file. It was a binary blob you could only edit in Power BI. You couldn’t diff it, you couldn’t script it, and you definitely couldn’t hand it to an AI agent and say “here, go build” or “change this visual to show x.”
Microsoft changed that with the Power BI Enhanced Report Format (PBIR) and the Power BI Project (PBIP) structure.
Now a report is a folder of human/agent-readable files:
TMDL for the semantic model (tables, columns, relationships, DAX measures)
PBIR JSON for the report itself (pages, visuals, and the fields each visual binds to)
Individual files mean git, deterministic edits, and perhaps most importantly: an agent can author the whole project without a single click in the Power BI UI.
How it Actually Works
First, a quick bit about the problem: pointing any AI at a data warehouse is the same one I hit in my analyst bake-off. On a clean, well-labeled dataset, AI tools look brilliant, but the second you connect them to a real database with cryptic table names and tribal-knowledge business logic, they start guessing. Guessing is how you get a beautiful dashboard that’s quietly, confidently wrong.
Solid solves that by being the governed semantic layer in the middle that remains consistent as data drifts. Those models can be consumed by agents to take actions in various systems, grounded in SQL generation that has been benchmarked and validated automatically. The model already knows how “net margin” is defined, which tables are authoritative, and how everything joins.
The appetite for agents using data is growing, and Solid helps make this reliable and maintainable. But, not everybody is thinking about agents. People still ask “What about my dashboards?” I wanted to answer that question.
So the flow looks like this:
Start from the model. A Solid semantic model built for a business domain is the baseline, containing tables, columns, metrics, and relationships. Building a model in Solid takes minutes, not weeks.
Ground with the Solid MCP. Cursor talks to Solid’s MCP server directly and invokes its text2sql tool to generate grounded SQL from the semantic model. It returns precise joins and filters directly from the source, ensuring the agent never hallucinates business rules. It can also look up business terms and asset metadata on the fly if it doesn’t understand something in the model fully.
Translate SQL → DAX. That grounded SQL becomes the source of truth for the DAX measures the agent writes into TMDL. A metric like a SUM or an AVG maps to a clean DAX measure; the model’s relationships become TMDL relationships one-for-one.
Build the report. The agent scaffolds the PBIR. It builds pages, cards, charts, tables, and binds each visual to the measures and columns it just generated. A simple Python script assembles it all into a Desktop-ready .pbip.
Open in Power BI. Drop the .pbip into Power BI Desktop against live Snowflake, and it renders. From there you can keep editing in Cursor, or push to the Power BI cloud when you’re ready.
The important part: at no point did I build the semantic model by hand in Power BI, and I never manually dropped a single visual onto the canvas. The model I’d already certified in Solid became the model in Power BI. That’s the whole pitch.
“Skill Issue”
The first time I tried this, it took a lot of iteration. Power BI’s project format has real landmines for an AI agent to go at it blind. Examples include a schema path that’s subtly wrong, a TMDL comment style that breaks the parser, a theme declared without its resource package. If you hit any one of these, the project won’t open. The difference between “magic” and “why won’t this load” came down to writing skill files that encode all of those rules up front along with a couple simple Python scripts the agent can reuse for generation and validation.
Now the agent knows the exact folder layout, the required files, the schema URLs, the traps to avoid, and the SQL-to-DAX translation rules before it writes a single line. It grounds every number through the Solid MCP, stays inside the model’s bounds, and hands me a project that opens on the first try. It turned a fiddly, expert-only workflow into something I’d comfortably hand to an analyst who’s never seen TMDL.
Let’s Build
Talk is cheap, so let me show you exactly what I’m about to run. I’m using ACMEBank, a demo bank environment we built in Solid to show off banking use cases, and I’m going to build a complete report from scratch, backed by whichever semantic model actually fits the use case.
That last part matters. I’m not hand-picking tables. My prompt literally tells Cursor to go find the right model, and Solid’s MCP does the routing to the right certified semantic model in its system.
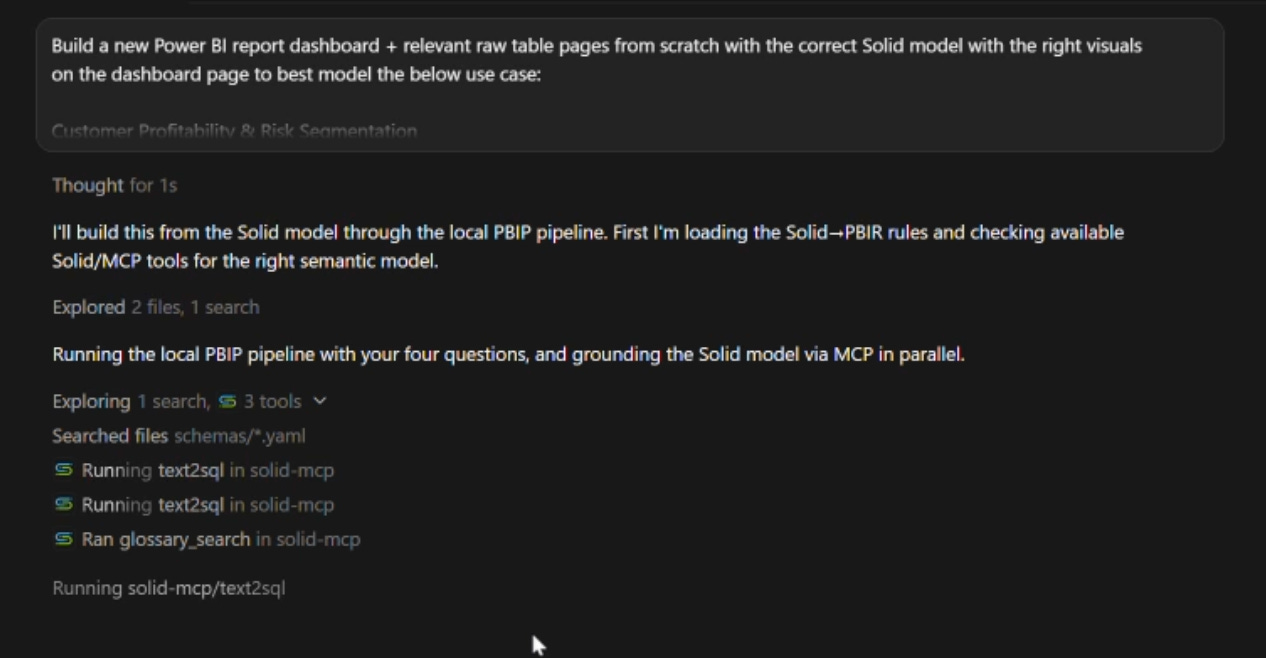
Here’s the prompt, verbatim:
Build a new Power BI report dashboard + relevant raw table pages from scratch with the correct Solid model with the right visuals on the dashboard page to best model the below use case:
Customer Profitability & Risk Segmentation
-Show net margin trends for customers in the top profitability tier
-Which customers have overdue KYC reviews relative to their last review date?
-How does profitability vary by customer risk rating?
-Which household groups show declining net margin over consecutive periods?
Solid routes the use case to the right model, grounds every metric (net margin, estimated annual value, days-since-outreach) in real SQL, the agent translates that into DAX and PBIR, and I get two .pbip projects I can open side by side in Desktop.
No modeling TMDL, writing DAX expressions, or building report tiles. Here’s the final result:
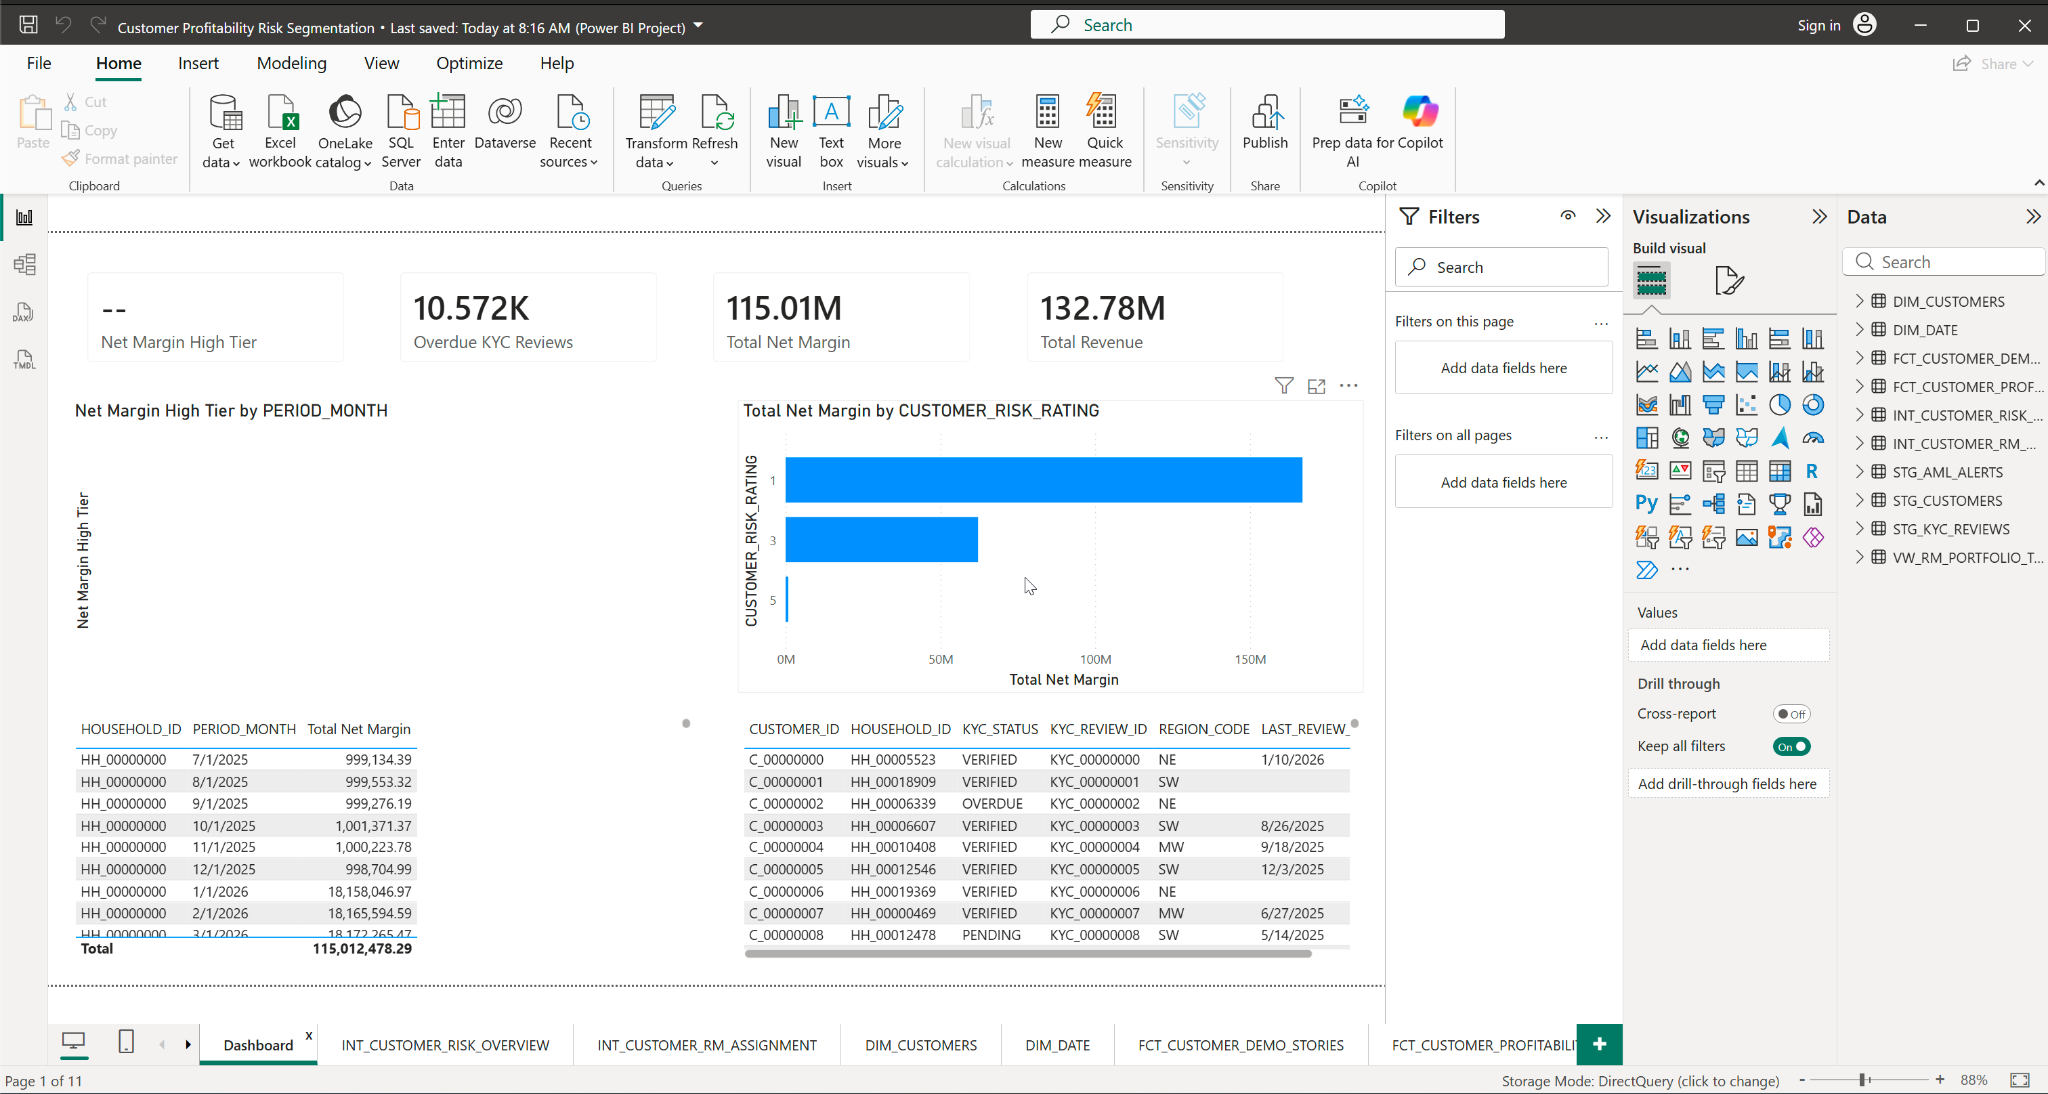
A final report dashboard (though underlying data is missing in one of the visuals) + table tabs.
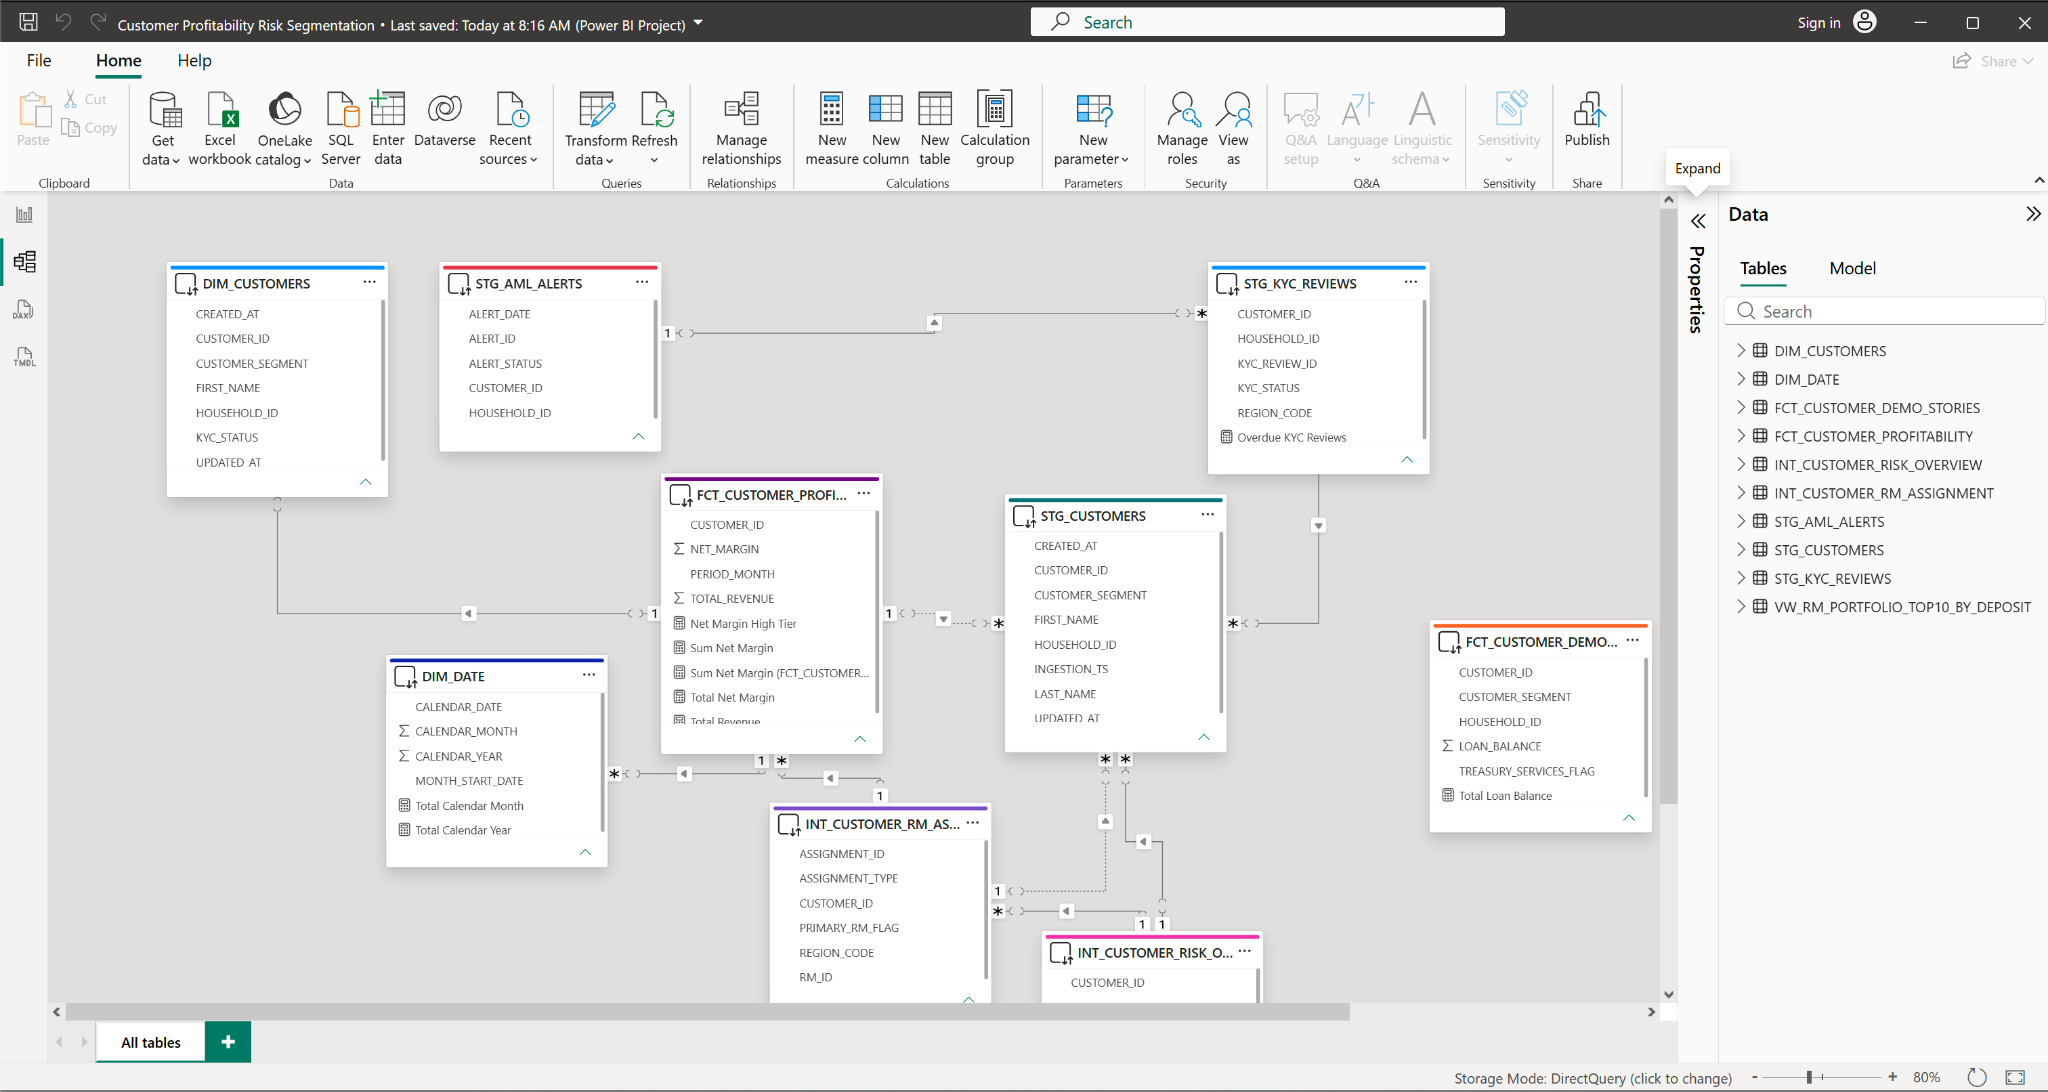
Cursor modeled the TMDL beautifully with the right DAX expressions and joins, all based on Solid’s model and the skill file we created.
Reality Check
I promised that I’d always give the honest take when evaluating tools, so here’s where the shine comes off a little.
Not every metric always maps 1:1. Simple aggregates translate to DAX beautifully. But some of these ACMEBank questions lean on window and share-of-total math e.g. “declining net margin over consecutive periods,” “no outreach in the last 90 days,” etc., and those don’t always have a tidy scalar DAX equivalent. The skill file flags these rather than emitting something broken so you can review or edit these.
Sometimes Cursor hits a snag. This is to be expected with pretty much all AI tools, and agents are getting better at self-correcting. I had to restart the demo video recording a couple of times because Cursor hit a random Python error. It self-corrected without my input, but it made for a messier demo. This really is less of an issue as it is just some honesty about how agents make mistakes, but fortunately self-correct (most of the time).
Desktop is still the final judge. The validation I run catches structural problems, but Power BI Desktop opening the file is the real test. I still reopen and eyeball it every time before I’d ever push it. BUT, the sheer number of reports you could generate more quickly frees you up to do more high value work.
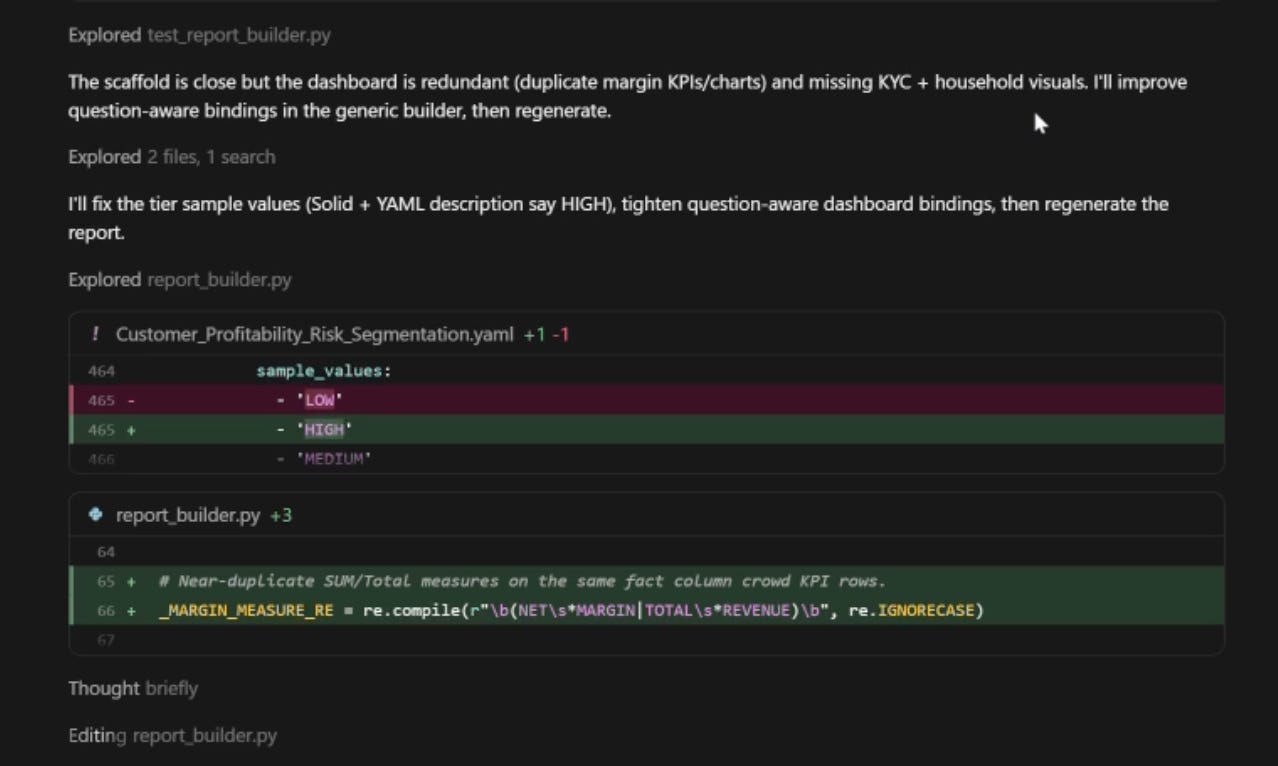
Cursor hitting a snag with one of the scripts it built, and self-correcting.
Neither of these are dealbreakers. They’re the kind of rough edges you’d expect from a proof of concept, and honestly, I haven’t found a limitation yet that made me want to stop.
Why I think this matters
In my analyst comparison, the takeaway was that the job wasn’t going away, it was evolving. I was still the one asking the right questions and directing the work; the AI just did the building. This is the same story, just with BI development instead.
The reason that “chat with your data” solutions never fully delivered on visual reports is that unless you specifically prescribe the exact visuals you want, you’ll always get something different, even if the underlying data is governed.
A governed semantic model plus a files-based report format gives you something durable: a real, refreshable, shareable Power BI report that traces every number back to a certified definition. You get the speed of vibe-building with the trust of a governed layer underneath it. That combination is what I couldn’t stop thinking about.
What would you build if the report just… built itself? Let us know in the comments!
Dashboards stopped planking and discovered their power